You have access to the Search Term Insights report via https://ad-optimizer.metoda.com/report. You can log in with your metoda account (email and password).
Important Note:
-
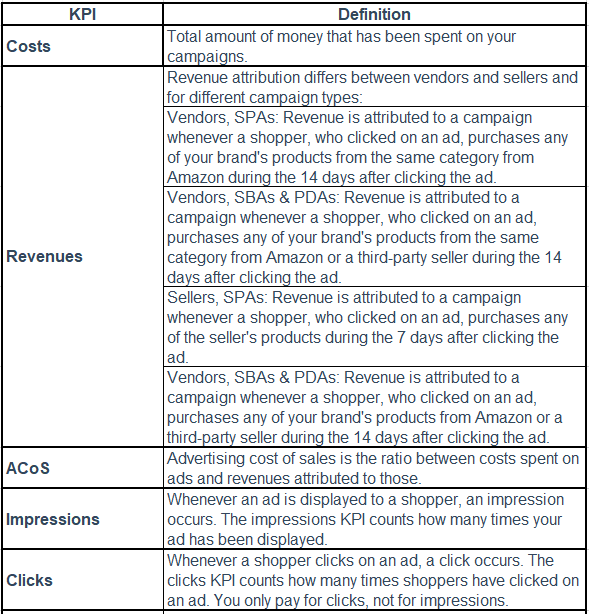
As Amazon does not grant access to live performance data, the costs/revenues shown for the latest two days are not yet final and should not be included in the performance analysis.
-
Only campaigns/search terms that have generated at least one click are included in our reporting. This leads to differences in impressions compared to Amazon, as campaigns and search terms without clicks are not included in our reporting.
-
Only campaigns that are managed by metoda are included in our report according to “metoda managed” campaigns in the Campaign Insights report.
1. Scope of the Report
With the Search Term Insights report, the performance of your campaigns can now be evaluated according to search term type. This means you can review KPIs like revenue and costs clustered by branded, competitor, and generic search queries. With only a few clicks you get answers to important questions like "How much revenue is generated by branded keywords?".
The search term data is aggregated on a yearly, monthly or weekly basis plus you can get insights for the current month. Moreover, the historical data is accessible from the initial onboarding of the metoda campaigns until the present. Therefore, you are able to see the development of all advertising KPIs per search term type over the entire campaign duration.
The report also gives insights into which brand expressions (brand names in search terms) are the most relevant in the customer search process on Amazon.
2. Report Settings
An individual onboarding process enables to set up of an exact brand mapping and search term classification. During the beta phase, an initial setup has been made for you by our Customer Success Team. All attributions can be adapted anytime and all historical data will be recalculated and updated within just one day. You can view the classification and brand mapping details on the "Search Terms" tabs. For adaptations just reach out to your metoda contact.
The basis for the report settings is an automatically generated list of brand names as they are listed on Amazon related to your campaigns.
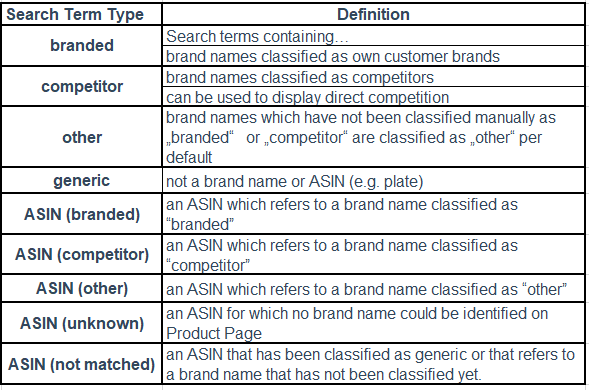
Own brands (search term type “branded”) are identified from all brand names listed on Amazon product pages for all of your advertised products, if the related campaigns have generated clicks and thereby, costs. All other brands are identified by collecting brand names from ASINs which have been targeted successfully (generated costs) by your campaigns. This list is updated every day, but it could be that relevant own or competitor brands are missing. These brand names can be added manually.
Tips & Tricks: The “Search Terms” tab in the report helps you identify missing own or competitor brand names. You can filter search term type “generic” and verify which of the listed search terms contain a brand name that should be classified as branded or competitor. Therefore, the KPIs serve as relevant indicators.
Also, misleading brand names can be classified as generic as they could significantly distort the results. Example: Brand name “Home” is listed in the report settings list as there are some products listed for this brand name. The brand name “Home” is classified as search term type “other” by default. Consequently, all search terms containing the word “home” are included in the results for search term type “other” although most of them are generic. Many found brand names listed on Amazon which are obviously no brand names like “Unknown” or “No brand” are automatically identified by our systems and classified as generic in various languages.
3. Report Structure
The Search Term Insights report is divided into two tabs with several sections.
Tabs
-
Overview
-
Search Terms

Sections
-
Filters
-
Content
-
Tables
-
History Charts
-
The tabs and sections are explained in further detail below.
3.1 Tab - Overview
The Overview includes a matrix table that gives you an overview of the most important KPIs listed by Search Term Type. With the help of the drill-down or expand hierarchy function (left corner above the table → see also 4. for general functions of the report) you have the possibility to view the KPIs aggregated for each brand name included in a search term. Two comma-separated brand names indicate that both brand names are included in the related search terms.
3.1.1 Filters
Use filters in order to analyze the Ad Optimizer KPIs for a specific part of your campaigns. The KPIs in all further sections will adjust according to the filters that have been set.


3.1.1 Table - Performance by Search Term Type
This table gives an overview on the performance KPIs according to search term type. With the help of the hierarchy function (left corner above the table name, middle and left button) you have the possibility to show all elements on next hierarchy level. Second hierarchy level shows the brand names which are included in the related search terms.

Search Term Types:
KPIs:

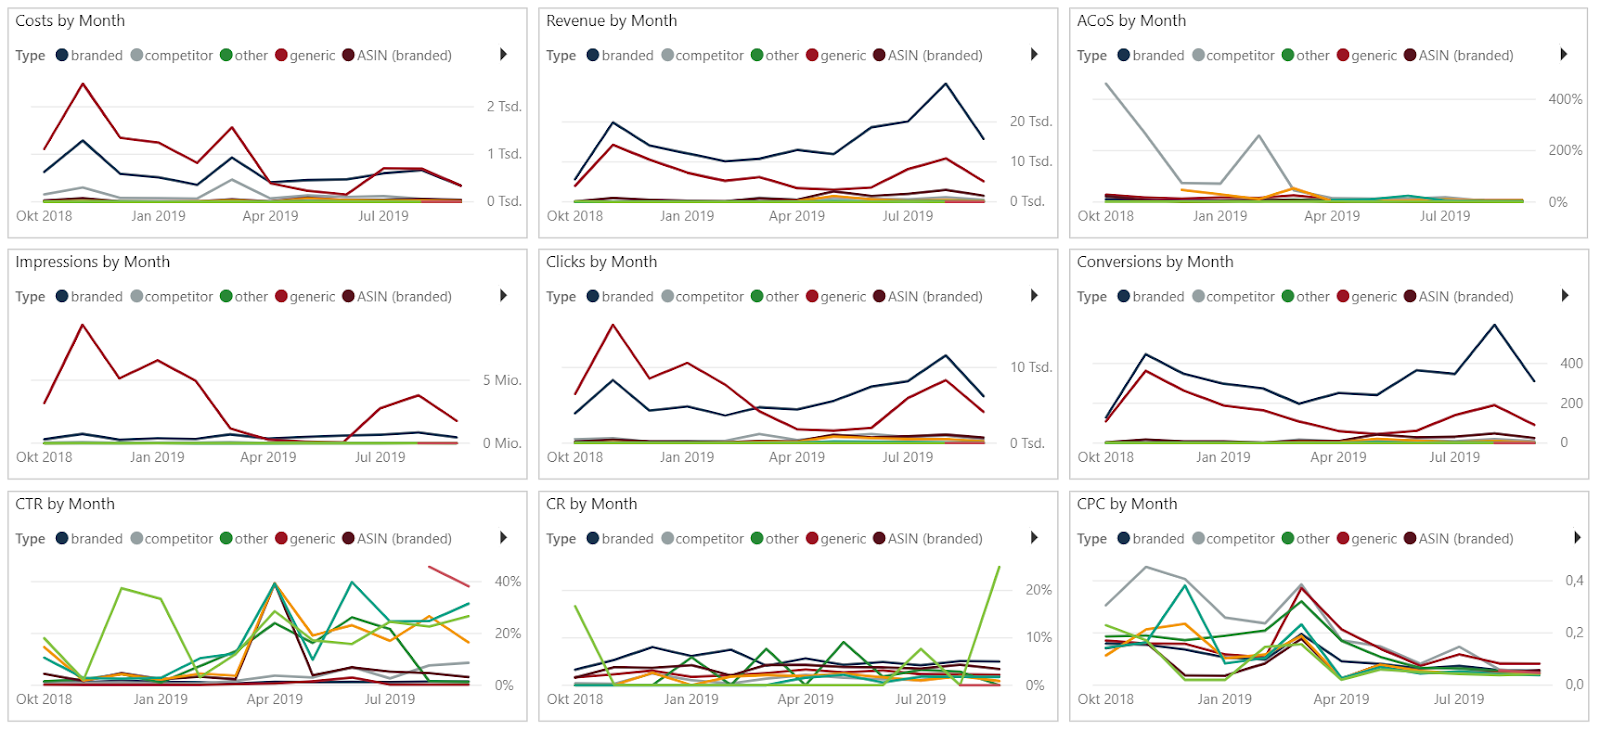
3.1.3 Development of KPIs by Search Term Type
The same KPIs as in the above table are displayed in 9 history charts by Search Term Type in their development over time.
3.2 Tab - Search Terms
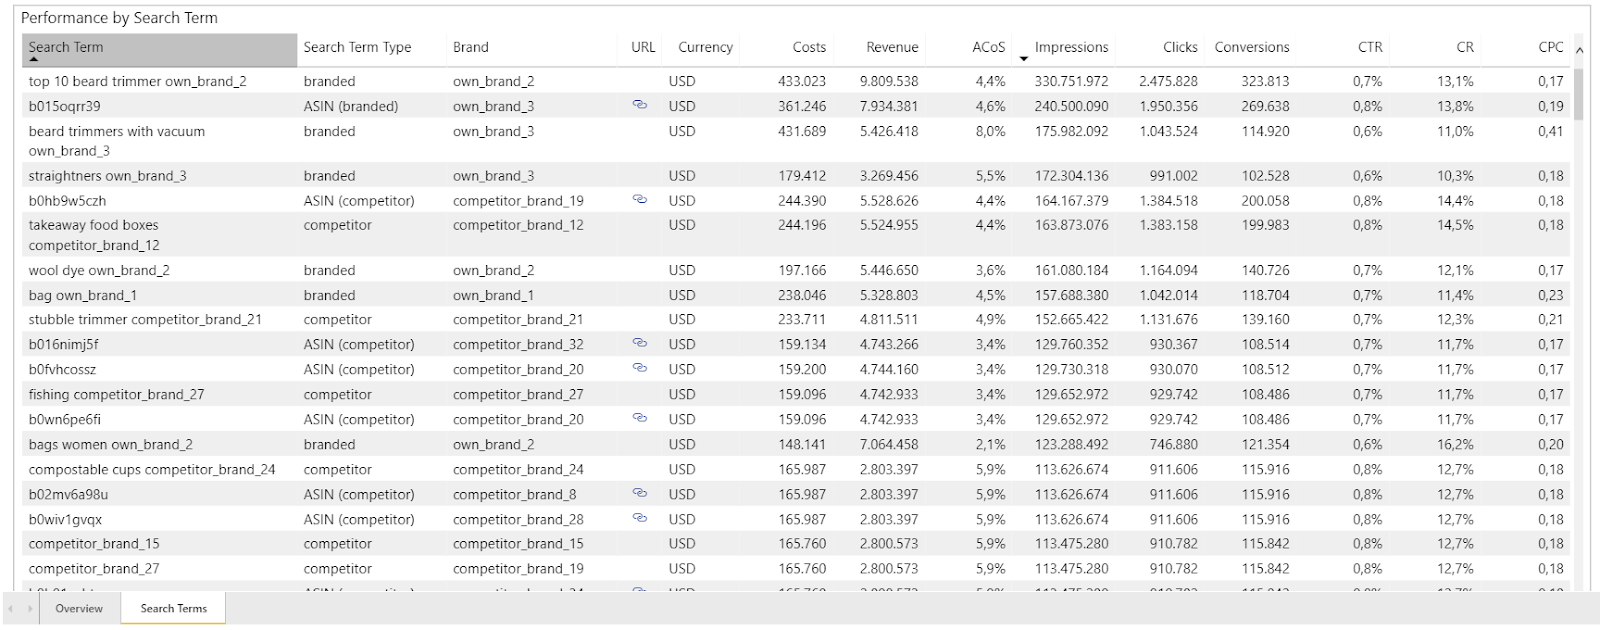
The Search Terms Tab includes a slightly different filter section and a table with all search terms listed with Search Term Type and KPIs as performance indicators. All KPIs are aggregated over whole Ad Optimizer contract duration.
3.2.1 Filters


3.2.2 Table - Search Terms
This table lists all search terms with their search term type. For all search terms containing a brand name, the unified brand name as defined by user during report setup is shown. For all search terms containing an ASIN, the URL links to the Amazon product page, if available. Moreover, the table displays all Ad Optimizer KPIs aggregated over the whole timespan.
4. General Functions of the Report
-
Clicking on headlines of columns activates sorting (A-Z), clicking again sorts Z-A.
-
Clicking on a certain table field, a graph or a label in a graph, you can highlight the selected element. Click again to remove the highlighting.
-
Filtering: by clicking the desired value, click again or use the rubber symbol in order to clear filters
-
Multiple selection: you can select multiple items by pressing "ctrl" on your keyboard and clicking on the items
Above the tables and visuals, several buttons allow you to further analyze data. Hover above the table to see them.
1. 2. 3. 4. 5. 6. 7.

1. Drill-up: Go to the hierarchy level above.
2. Drill-down: Go to the next level in the hierarchy.
3. Expand all down one level in the hierarchy.
4. Enable Drill-mode: Now you have the option of drilling down one row at a time or expand all sublevels of one selected element.
5. Shows filters and slicers affecting this visual
6. Focus mode: can be used in order to zoom into a specific table or graph.
7. More Options:
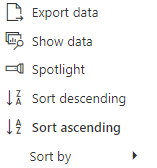
Export data: you can download data into an Excel- or CSV-file (export can take several seconds). You have two options:
- Summarized data: data as shown in the table
- Underlying data: all data from the whole report

