This article shows you how to deal with the Campaign Insights V2 report in relation to your performance, budget, and benchmarks.
You have access to Campaign Insights Report via ad-optimizer.metoda.com/report. You can login with your metoda account (email and password).
IMPORTANT NOTE:
-
As Amazon does not grant access to live performance data, the costs/revenues shown for the current day and the day before are not yet final and should not be included in performance analysis.
The Campaign Insights report is divided into several sections:
-
1. Performance
-
2. Budget
-
3. Benchmarking
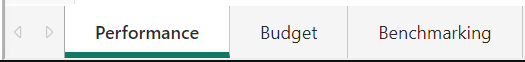
The bottom section of the reporting has three views: Performance, Budget & Benchmarking. You can switch from one to another using the tabs below the report. By default, the Performance tab is active, and the Performance details are shown.
These sections will be explained in further detail below.
General functions of the reports
-
Clicking on headlines of columns activates sorting (A-Z / date), clicking again sorts Z-A.
-
Filtering: by clicking the desired value, click again or use the rubber symbol in order to clear filters
-
Multiple selection: you can select multiple items by pressing "ctrl" on your keyboard and clicking on the items
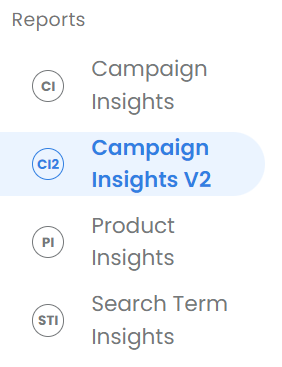
Click on Campaign Insights V2
1. Performance
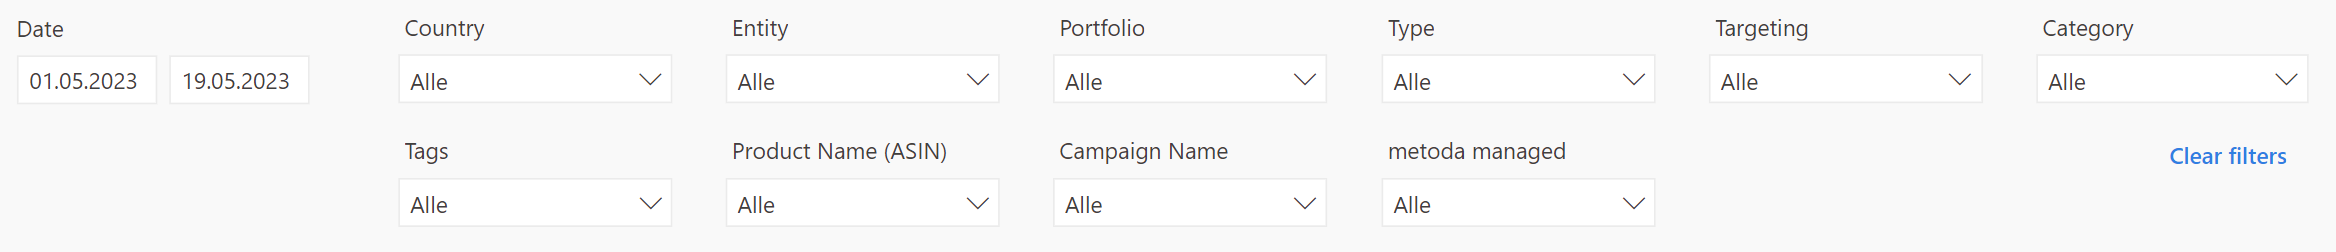
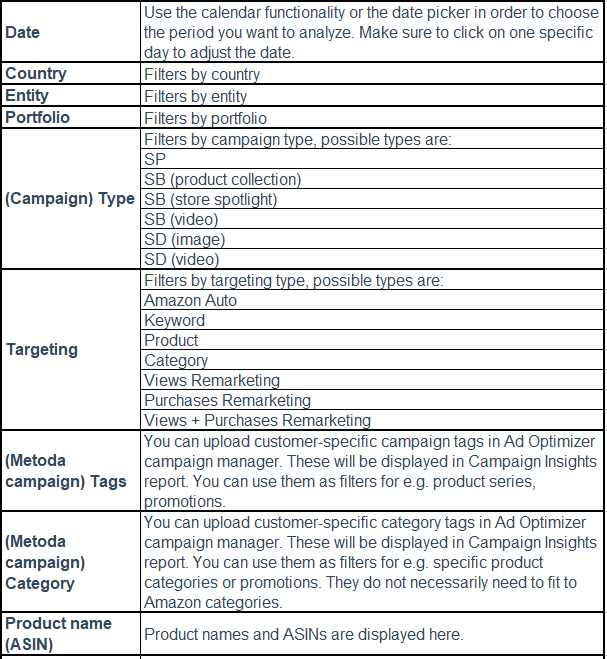
1.1 Filters
Use filters in order to analyze the KPIs for a specific part of your campaigns. The KPIs in all further sections will adjust according to the filters that have been set.
Example: You want to analyze data for February 2023, you should choose the 1st and the 31st of February as dates.
1.2 Performance details

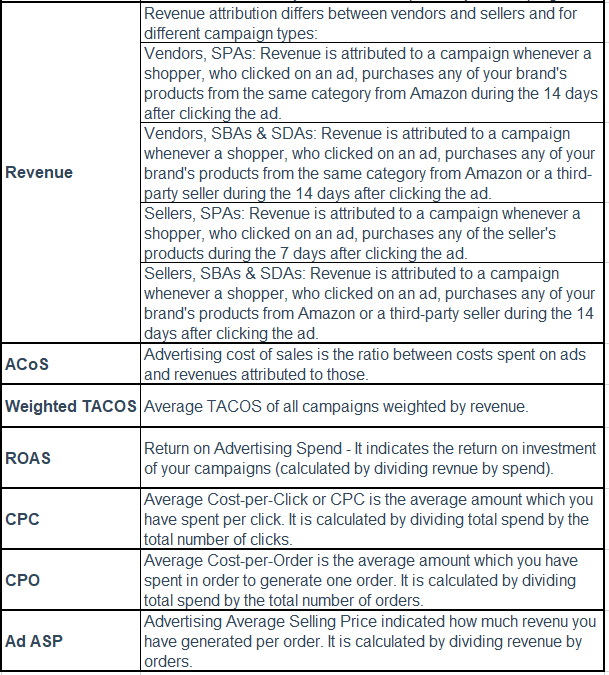
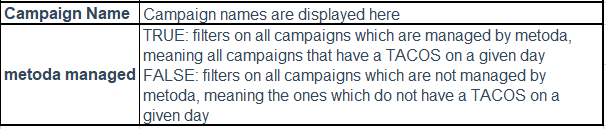
The performance details section presents you with the KPIs on entity, portfolio and campaign level. A click on link brings you to the product detail page of the advertised product.
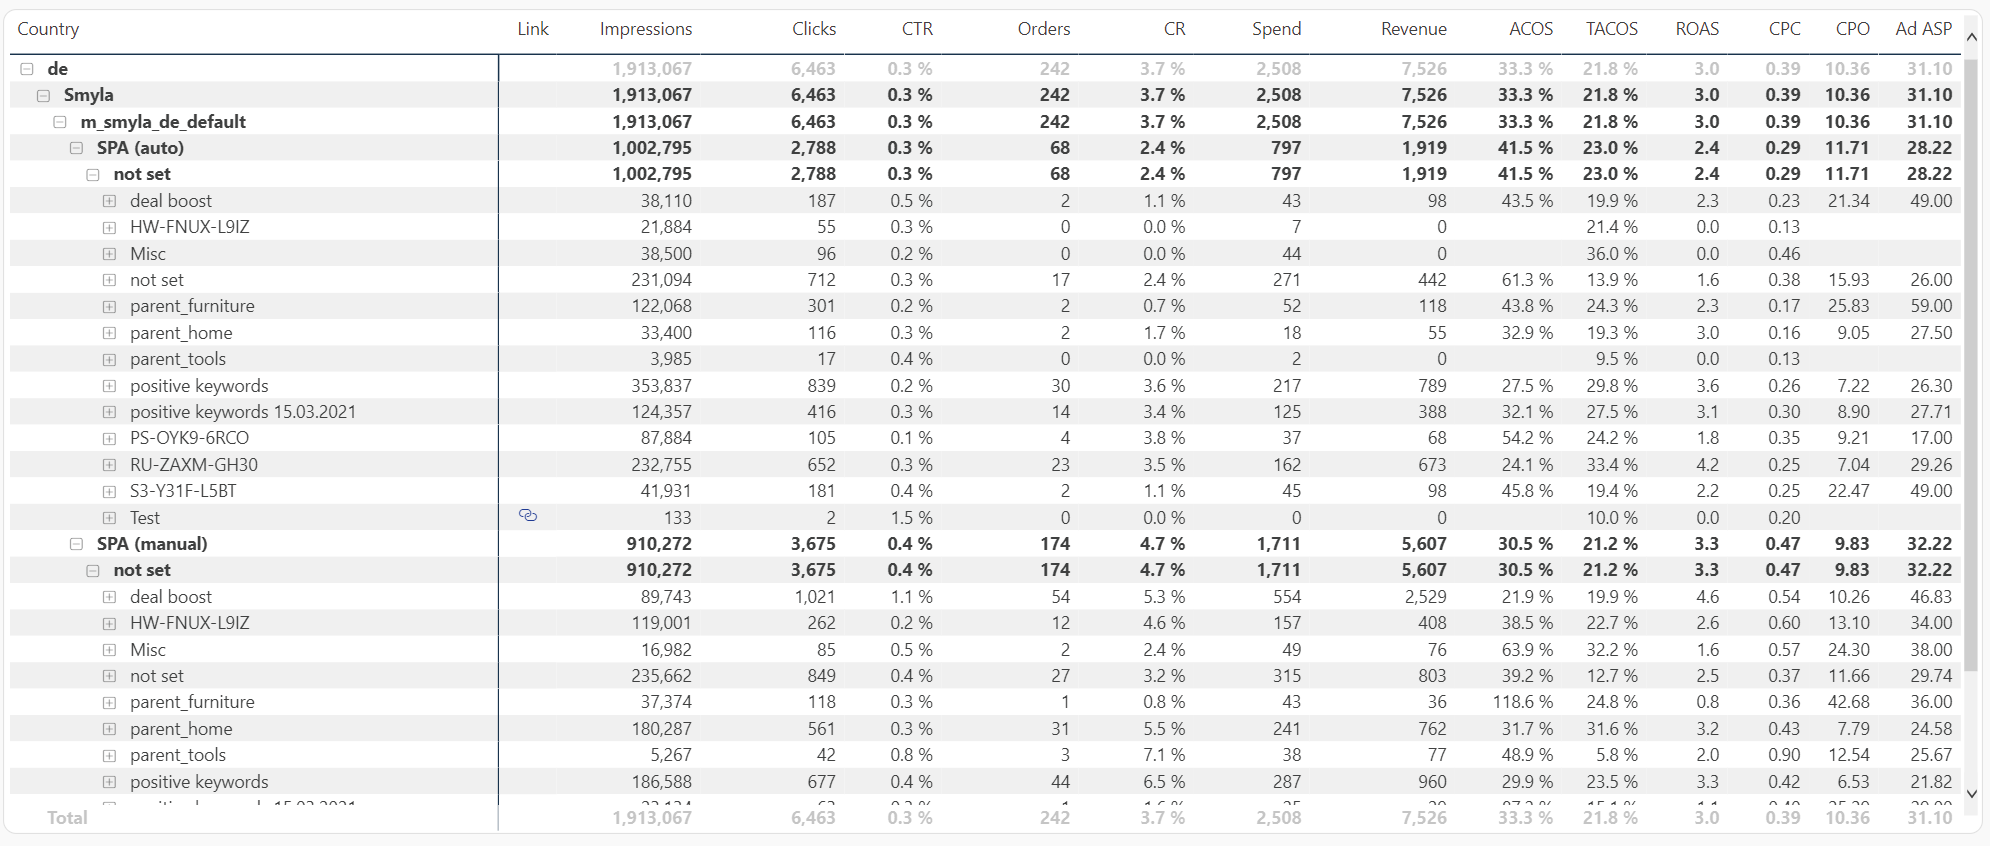
With the help of the drill-up function (left corner above the Campaign Name) you have the possibility to view the data on mutliple levels, from Country down to Campaign Name.

1.3 Development of KPIs
The KPIs are shown here in their development over time.

2. Budget
2.1 Filters

2.2 Budget Spend and Budget Potential
The budget section allows an overview on the development of budgets and spending over time.
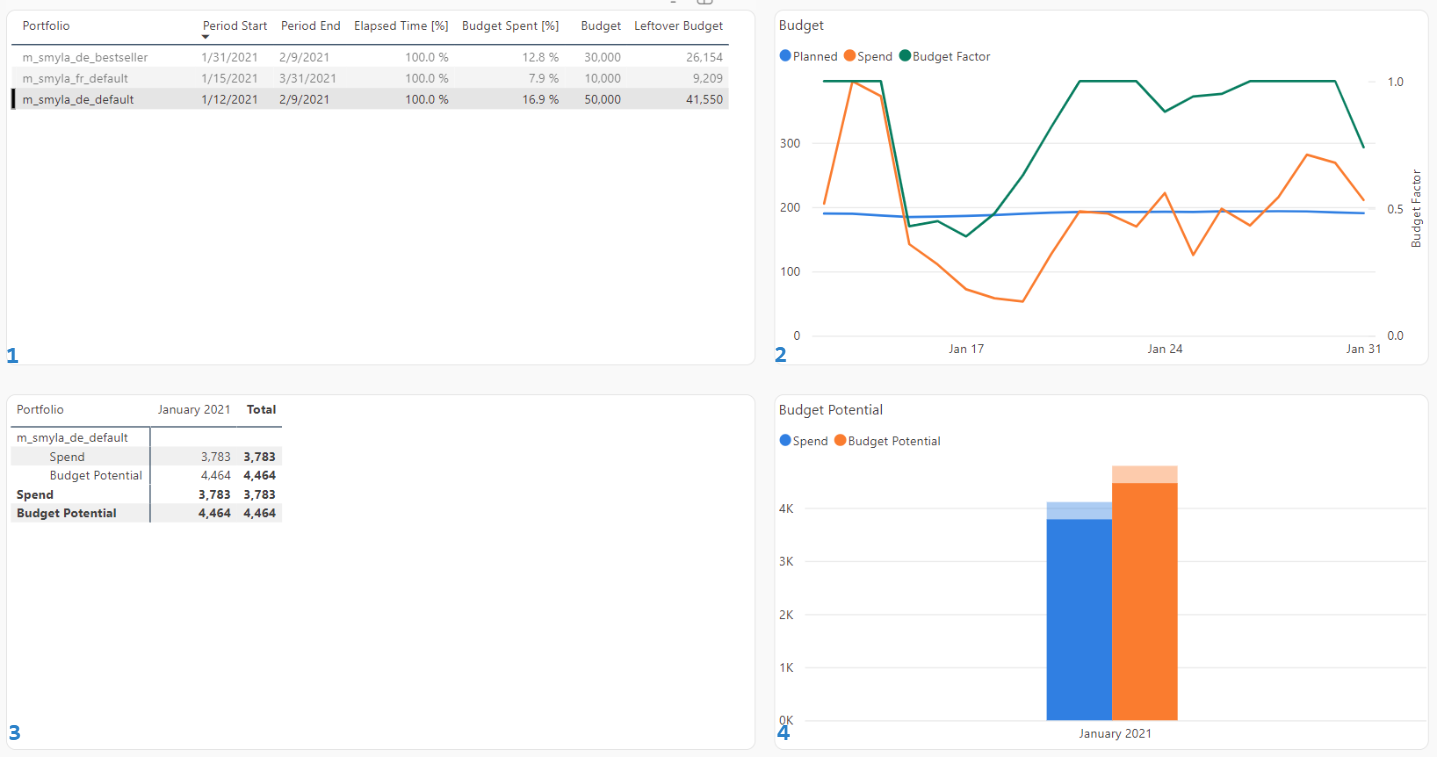
1. The table shows all budget periods within the time period which was selected in the filter area. Time elapsed (in %) and budget spent (in %) should ideally be on the same level.
2. Shows the planned budget and the actually spent budget for the selected budget period over time. The algorithm recalculates planned budgets continuously, taking actual spends into account. It also shows whether the budget can be spent given the current TACoS settings. It ranges from 0 to 1.
-
If the budget factor is below 1, this means that more budget could be spent given the active campaigns, the current TACoS settings and the traffic on Amazon.
-
If the budget factor is 1, this means that it is not possible to spend more budget given the active campaigns, the current TACoS settings and the traffic on Amazon.
3. The table shows the budget spent and the budget potential (calculated based on the budget factor).
4. The diagram shows the total budget that was spent in blue. The dark blue is what was spent from the selected portfolio. The same applies to the orange one.
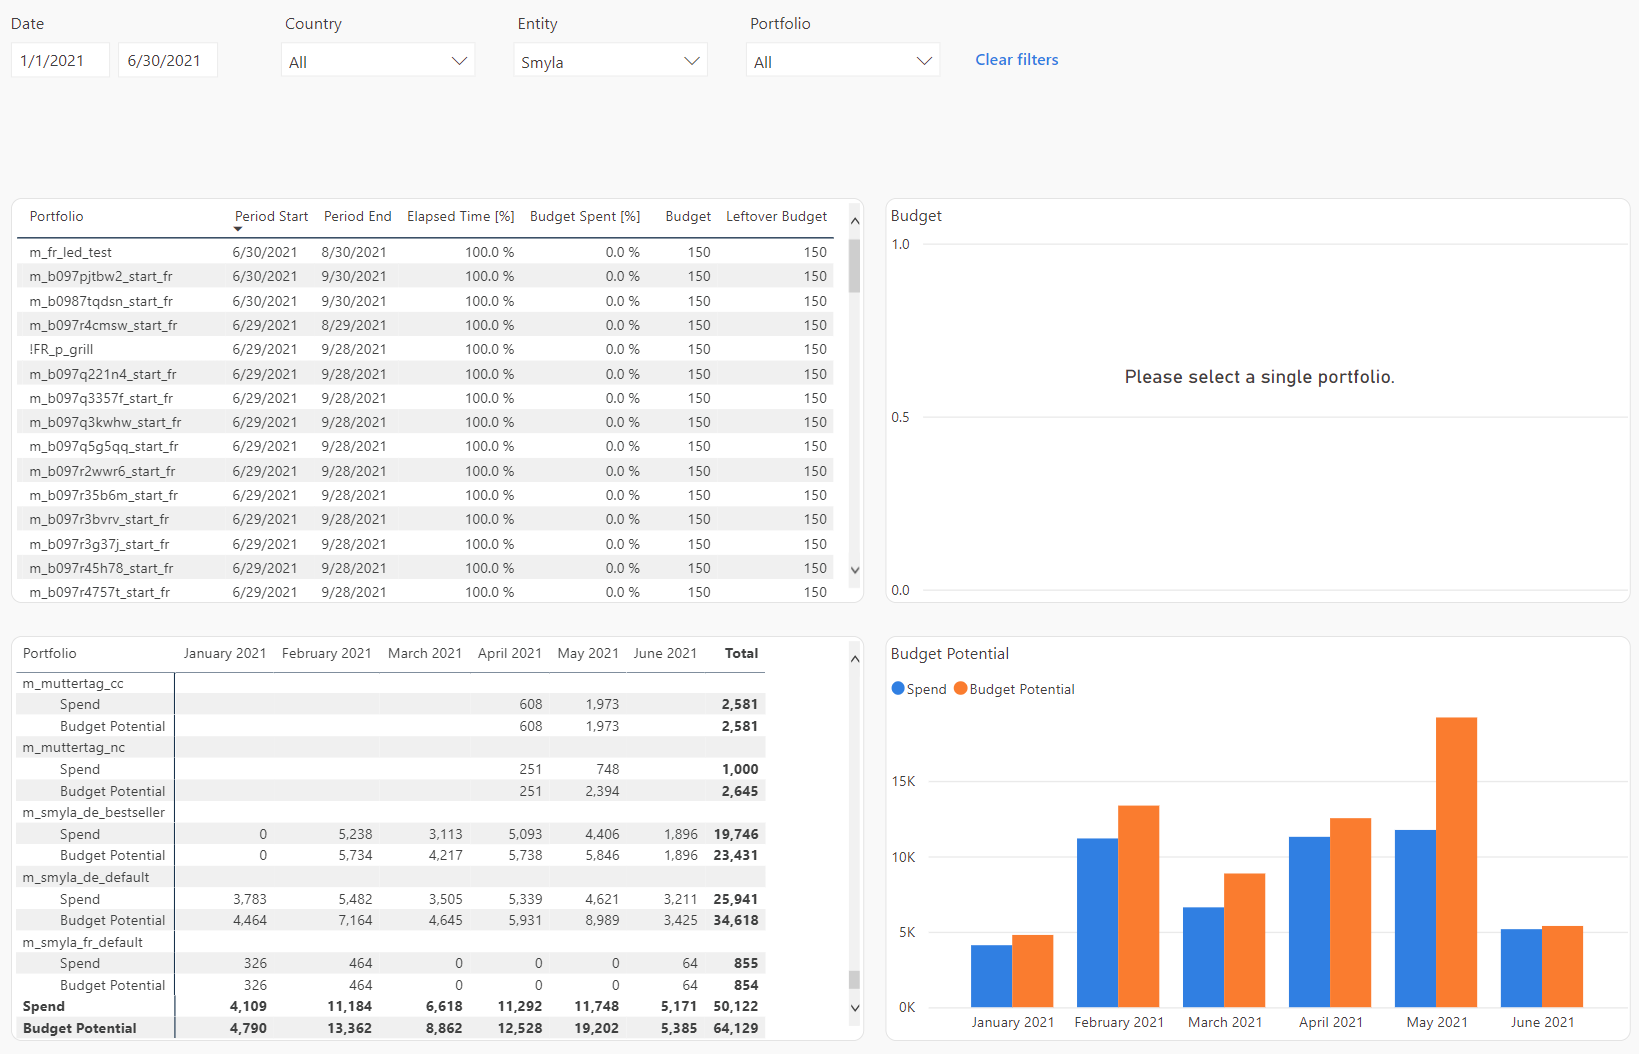
The same sections with different data.(example)
3. Benchmarking
3.1 Filters and KPIs
You can choose between different benchmark options: Year, Month, Week, Country, Entity, Portfolio, Campaign Type, Category & Product
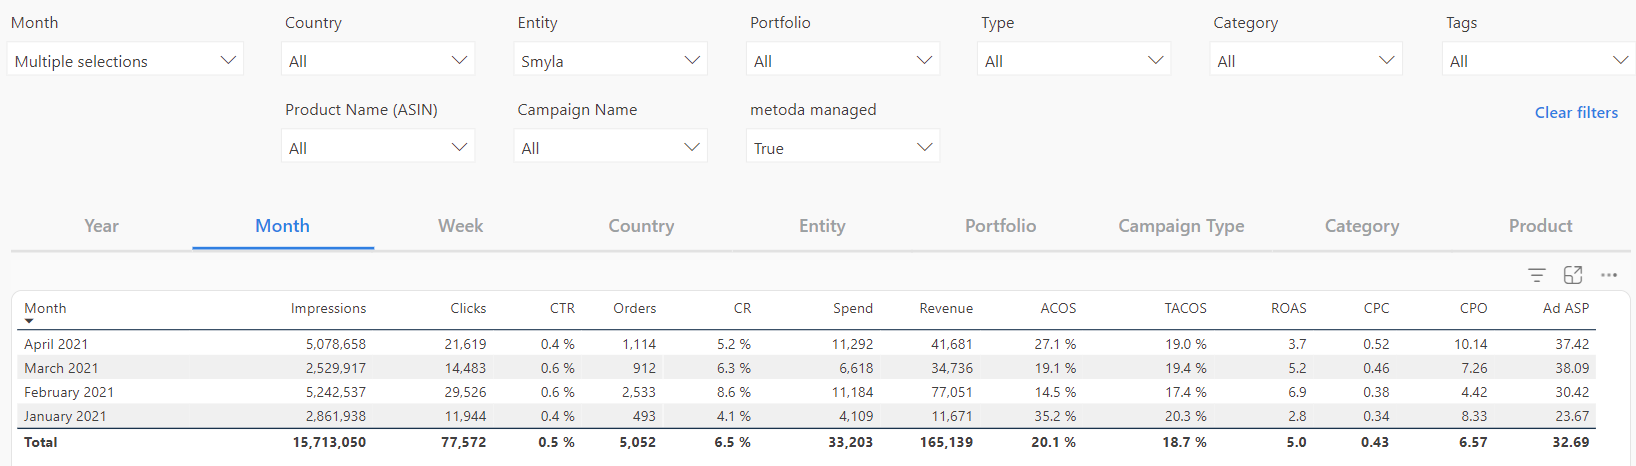
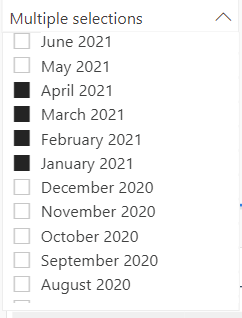
For year, month and week you can select individually.
For the others, you can specify a date range.
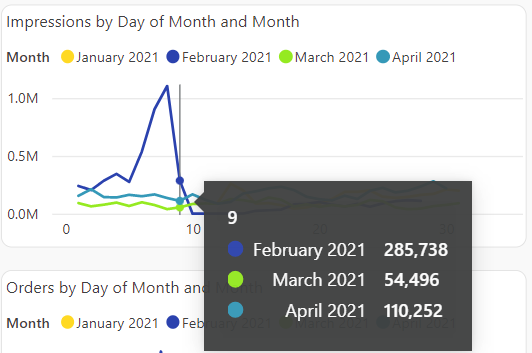
3.2 Comparison of KPI development
The data is displayed with dates in different colors.

Hover over the graphs to see accurate data.