
Reports: Campaign Insights Report
You have access to Campaign Insights Report via https://ad-optimizer.metoda.com/report. You can login with your metoda account (email and password).
IMPORTANT NOTE:
- As Amazon does not grant access to live performance data, the costs/revenues shown for the current day and the day before are not yet final and should not be included in performance analysis.
- Only keywords which have generated at least one click are included in our reporting. This leads to slight differences in impressions compared to Amazon, as campaigns and search terms without clicks are not included in our reporting.
The Campaign Insights report is divided into several sections:
- Dashboard
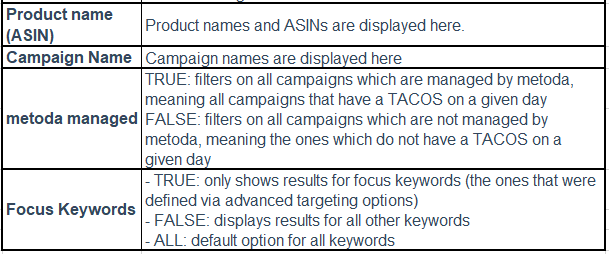
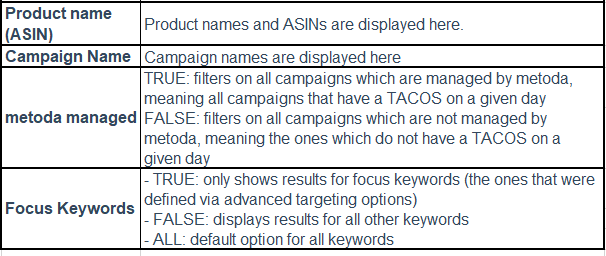
- Filters
- Budget
- KPIs
- Development of KPIs
- Insights
- Campaign Details
- Search Terms & Keywords
These sections will be explained in further detail below.
General functions of the reports
- Clicking on headlines of columns activates sorting (A-Z / date), clicking again sorts Z-A.
- Filtering: by clicking the desired value, click again or use the rubber symbol in order to clear filters
- Multiple selection: you can select multiple items by pressing "ctrl" on your keyboard and clicking on the items
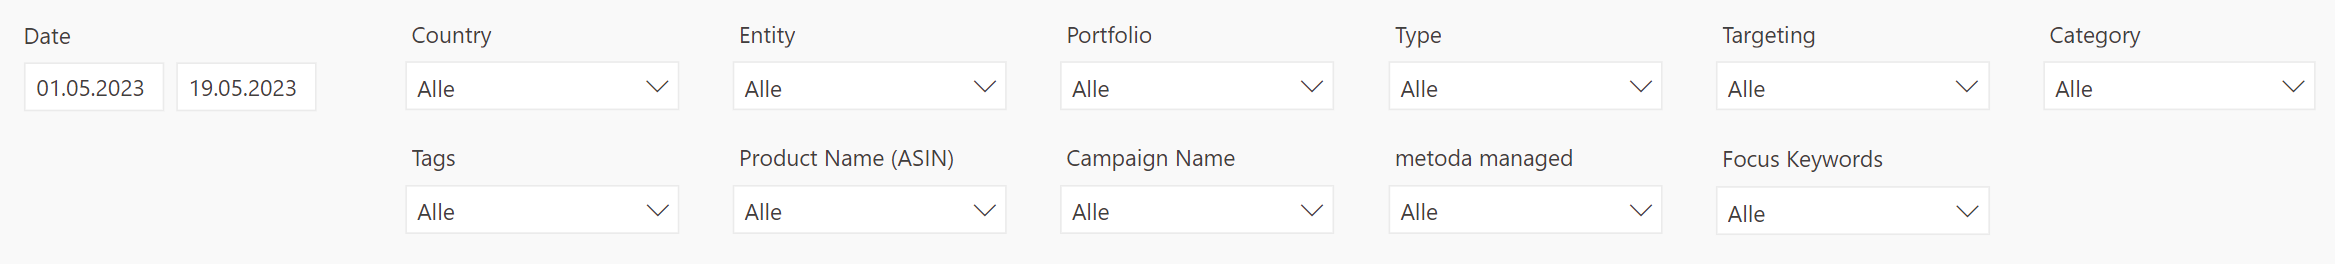
1. Filters
Use filters in order to analyze the KPIs for a specific part of your campaigns. The KPIs in all further sections will adjust according to the filters that have been set.
Example: You want to analyze data for Oktober 2021, you should choose the 1st and the 31st of October as dates.

2. Budget
The budget section allows an overview on the development of budgets and spendings over time.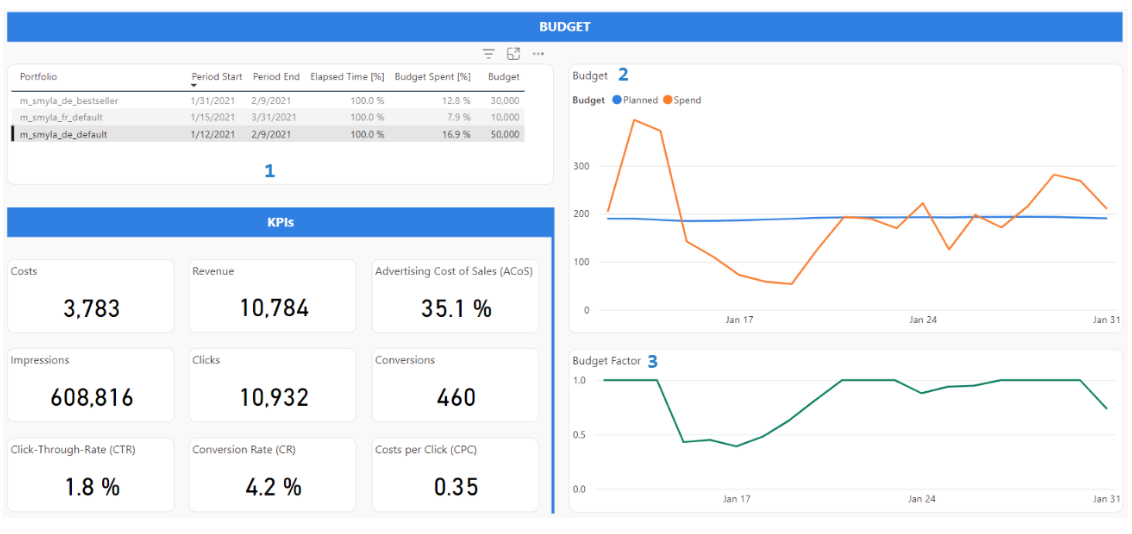
1. The table shows all budget periods within the time period which was selected in the filter area. Time elapsed (in %) and budget spent (in %) should ideally be on the same level.
2. Shows the planned budget and the actually spent budget for the selected budget period over time. The algorithm recalculates planned budgets continuously, taking actual spends into account.
3. Shows whether the budget can be spent given the active campaigns, the current TACoS settings and the traffic on Amazon. It ranges from 0 to 1.
- If the budget factor is below 1, this means that more budget could be spent given the current TACoS settings.
- If the budget factor is 1, this means that it is not possible to spend more budget given the current TACoS settings.
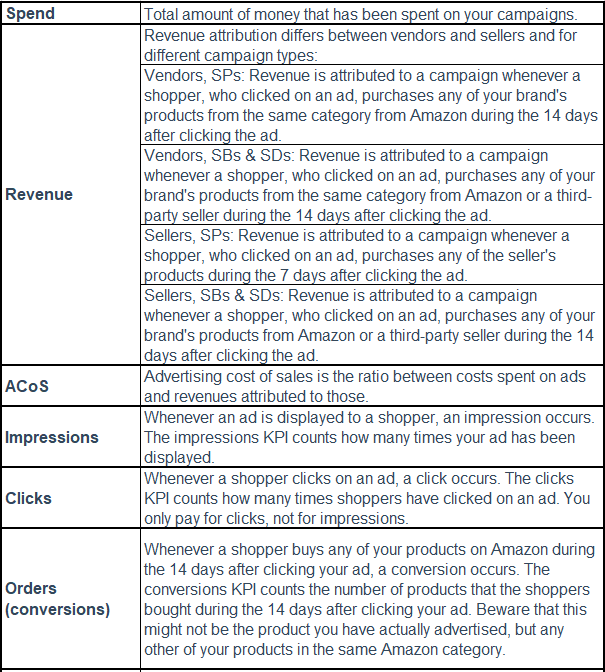
3. KPIs
The filters selected in the first section are applied to the KPIs displayed in this section. Please note that the filter on the budget period (in the budget table) is not applied to these KPIs.


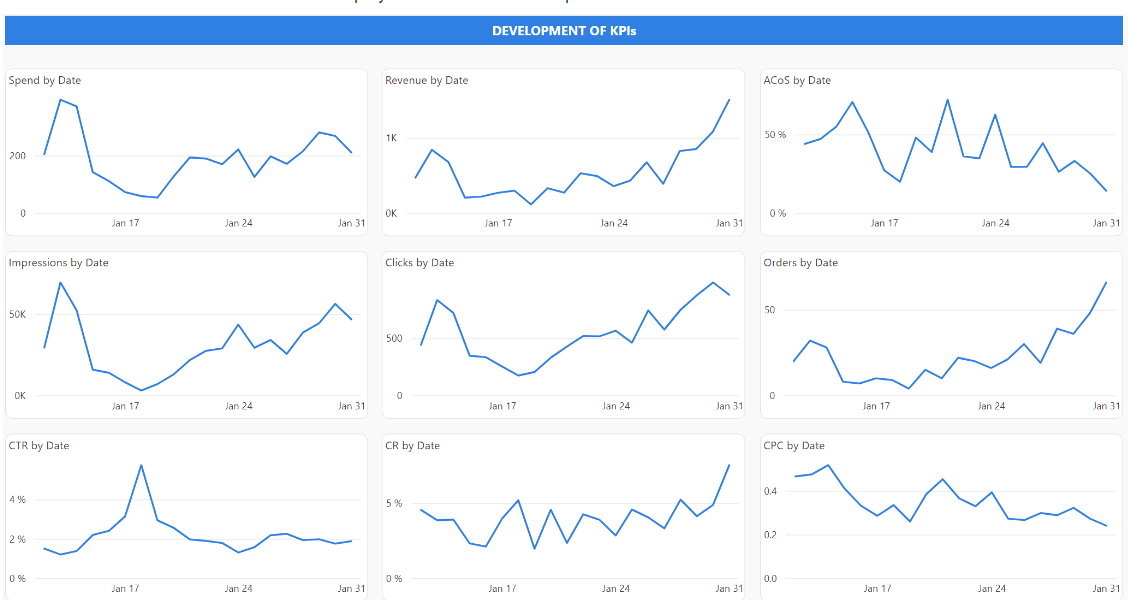
4. Development of KPIs
The same KPIs as in the KPI section are displayed here in their development over time.
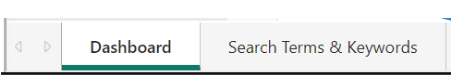
5. "Campaign details" and "Search Terms & Keywords"
The bottom section of the reporting has two views: campaign details and search terms & keywords. You can switch from one to another using the tabs below the report. By default, the dashboard tab is active and the campaign details are shown.
The campaign details section presents you with the KPIs on campaign level. A click on link brings you to the product detail page of the advertised product.

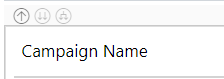
With the help of the drill-up function (left corner above the Campaign Name) you have the possibility to view the data also on product and category level.
The Search Terms & Keywords Tab includes a section that is divided into two tables. The table in the lefthand side gives you an overview on most relevant KPIs, while the table on the righthand side shows you data on the keyword level and further KPIs. Both tables interact with each other. Moreover, by using the drill-up function you also find the data on search term level. Please note that Amazon does not provide search term data for SBAs, therefore we display keywords on search term level as well.
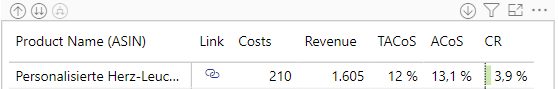
Within the left table you can also use the drill-up function to see the data on product and category level.
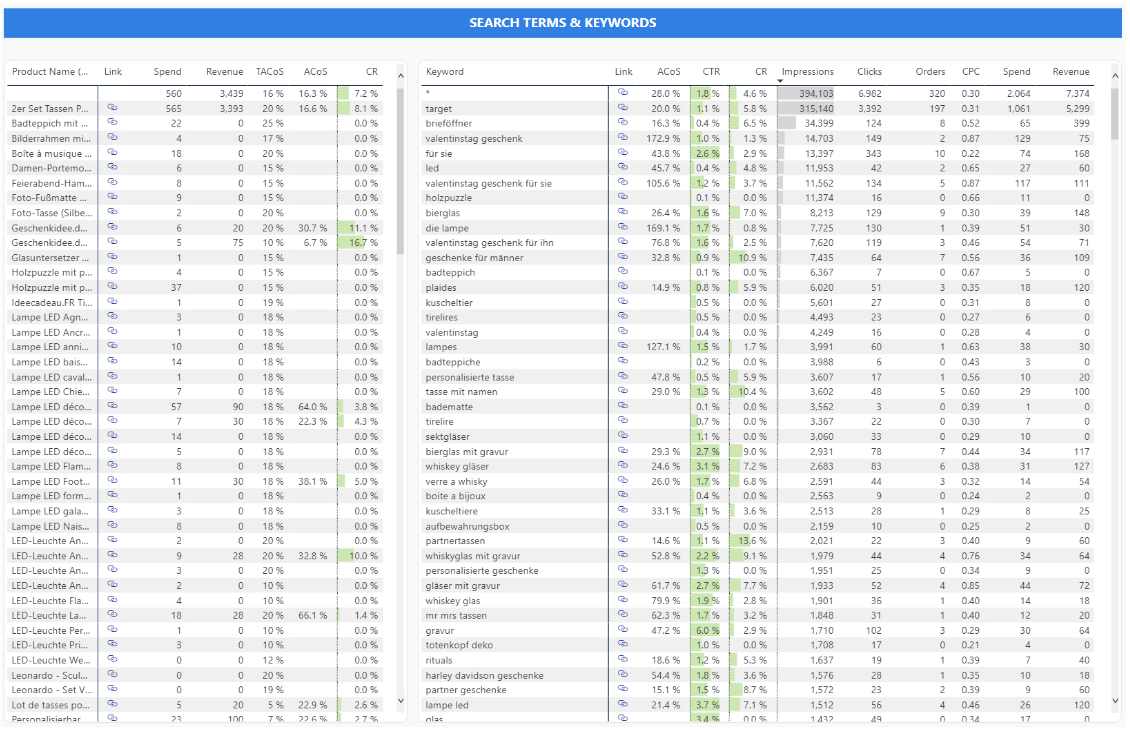
Above the tables, several buttons allow you to further analyze data.
1. 2. 3. 4. 5.
1. Drill-up: from campaign level, you can drill up to product level or category level.
2. Drill-down: from category level, you have two options to drill down (go straight down to next level in hierarchy or go down to the next level in hierarchy, but sorted by the elements from the upper hierarchy level).
3. Link (attached to SPAs): leads you to the product detail page of the advertised ASIN.4. Focus mode: can be used in order to zoom into a specific tabel or graph.
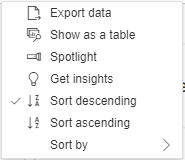
5. More Options:
Meaning of certain keywords in the Search Term Insights on keyword level
- Substitute
- Loose match
- Complement
- Close match
- E.g. Category: Medicine
The initial four categories represent the distinct Targeting Groups within SP (Amazon Auto), where Amazon delineates these into four unique types. The term "Category: Medicine" denotes a Category-Targeting campaign, which in this instance, is particularly focused on the "medicine" category.
Best practices for exporting data
- On Search Term Level
- Open the Campaign Insights V1 Report
- Click on the "Search Term" Tab and hover your mouse into the right table
- Click on the three dots for receiving more options
- Click on "Export data" and choose "Underlying data"
- Open the file and start your analysis
By following these steps you get daily data on search term level.
As you will receive a huge file with many rows data cleaning is often necessary when choosing this option.
- On Campaign Level
- Open the Campaign Insights V2 Report
- Hover your mouse to the "Performance" table
- Click on the three dots for receiving more options
- Click on "Export data" and choose "Underlying data"
- Open the file and start your analysis
By following these steps you get an easy to handle file of daily data on campaign level.
It contains performance on market, entity, campaign type, product, portfolio level etc.
- On Product Level
- Open the Campaign Insights V2 Report
- Hover your mouse to the "Performance" table
- Click on the drill-down button (showing arrows down) 5 times until you can't click it anymore
- Click on the three dots for receiving more options
- Click on "Export data" and choose "Underlying data"
- Open the file and start your analysis
By following these steps you get an easy to handle file of daily data on product level.
