Scope:
Monitoring product details of products with Sponsored Product Ad campaigns and identifying product issues.
Frequency of data collection and aggregation of provided data:
Based on a daily data collection, Product Insights Report provides monthly aggregated data (aggregated month to date for current month).
-
Data Collection: Daily
-
Aggregation: Monthly, month-to-date for current month
-
Data update in reporting tool: Daily
 Tips & Tricks
By right clicking on any Line in the Product Insights Table and selecting Drillthrough → see History, you can reach a special Product Development View (daily level).
The Product Insights Report can help you to identify performance issues of products using the following KPIs:
-
Low conversion rate
-
High ACoS/TACoS Ratio
The Product Insights Report gives the possibility to easily identify products with a performance issue. They either generate only a few or no conversions or have a rather high ACoS/TACoS Ratio. The first case means that customers click on the campaign but do not want to buy the product. In the second case, we cannot achieve the desired performance.
The Product Insights Report provides information, which can be helpful to identify possible reasons for performance issues:
-
Buybox & Availability
-
Content
-
Reviews & Ratings
-
Pricing
-
Ranking
-
Other reasons
1. Buybox & Availability
The Product Insights Report allows you to conveniently identify ASINs with availability & buybox issues, useful KPIs therefore are "Availability" , "Availability Rate" , "Buybox Owner" & "Buybox Owner Rate". You can see the availability rate of ASINs for the selected month. Furthermore, you can see who currently owns the buybox and the "Buybox Owner Rate" tells you for which percentage of observations Amazon has held the buybox for the ASIN.
2. Content
The Product Insights Report contains an overview of content-related KPIs, which can be used to quickly identify issues:
-
Number of bullet points & the length
-
Description [yes/no] & Description length
-
A+ Content [yes/no]
-
Number of images
-
Number of videos
These content KPIs can indicate whether a product page is attractive for a customer or not. Appealing product pages have a significant influence on the customer's purchasing probability.
According to our best practices, we recommend to have at least three bullet points, two images, a product description and A+ Content.
3. Reviews & Rating
Reviews & ratings have a powerful influence on the purchase decisions. Bad reviews and ratings or no reviews and ratings might deter customers from purchasing a product. The Product Insights Report gives an overview of the number of reviews and the rating per product, which allows you to see at one glance which products are having issues and room for improvement. A product should ideally have at least 20 reviews and not less than 3.5 stars.
4. Pricing
The Product Insights Report can help you with analyzing pricing information for your products using the following KPIs:
-
Ad ASP/Buybox Price Ratio
-
Substitutes & their prices
The Ad ASP/Buybox Price Ratio compares the Buybox price and Average Sales Price (ASP). At a value of 100%, the buy box price is exactly the same as the ASP. Since Amazon delivers the BuyBox price in gross, but the ASP in net, a certain deviation is to be expected (consider country-/product-specific taxes). Values above 130% or below 70% may indicate that customers did not buy the advertised product, but another product of the same brand and category.
Additionally, you can find information about substitute products displayed on the Amazon product detail page, including information about the ASIN, its brand and its buybox price. This information helps you to identify which products are considered as direct subsitutes of your product by Amazon. The substitute could either be your own product or a competitor product.

By right-clicking on any Line in the Product Insights Table and selecting Drillthrough → see History, you can reach a special Product Development View (daily level)
Buybox Information
Shows the Highest, Average, and Lowest Buybox price over the last 30/90 days.
5. Bestseller Ranking
The Amazon bestseller rank (or sales rank) of a product is an important indicator in terms of product performance. It indicates how well the product is selling compared to all other products in the same category. The rank represents all sales of a product, i.e. organic and payed and the better the sales rank, the better usually is a products organic visibility. The monitoring of the changes in the bestseller rankings of your products helps you to understand if certain marketing activities have a sustainable impact on your product sales.
And, if a product has a “Bestseller” badge in its category (rank = 1) sales increases, because customers trust that this is a quality characteristic.

By right-clicking on any Line in the Product Insights Table and selecting Drillthrough → see History, you can reach a special Product Development View (daily level)
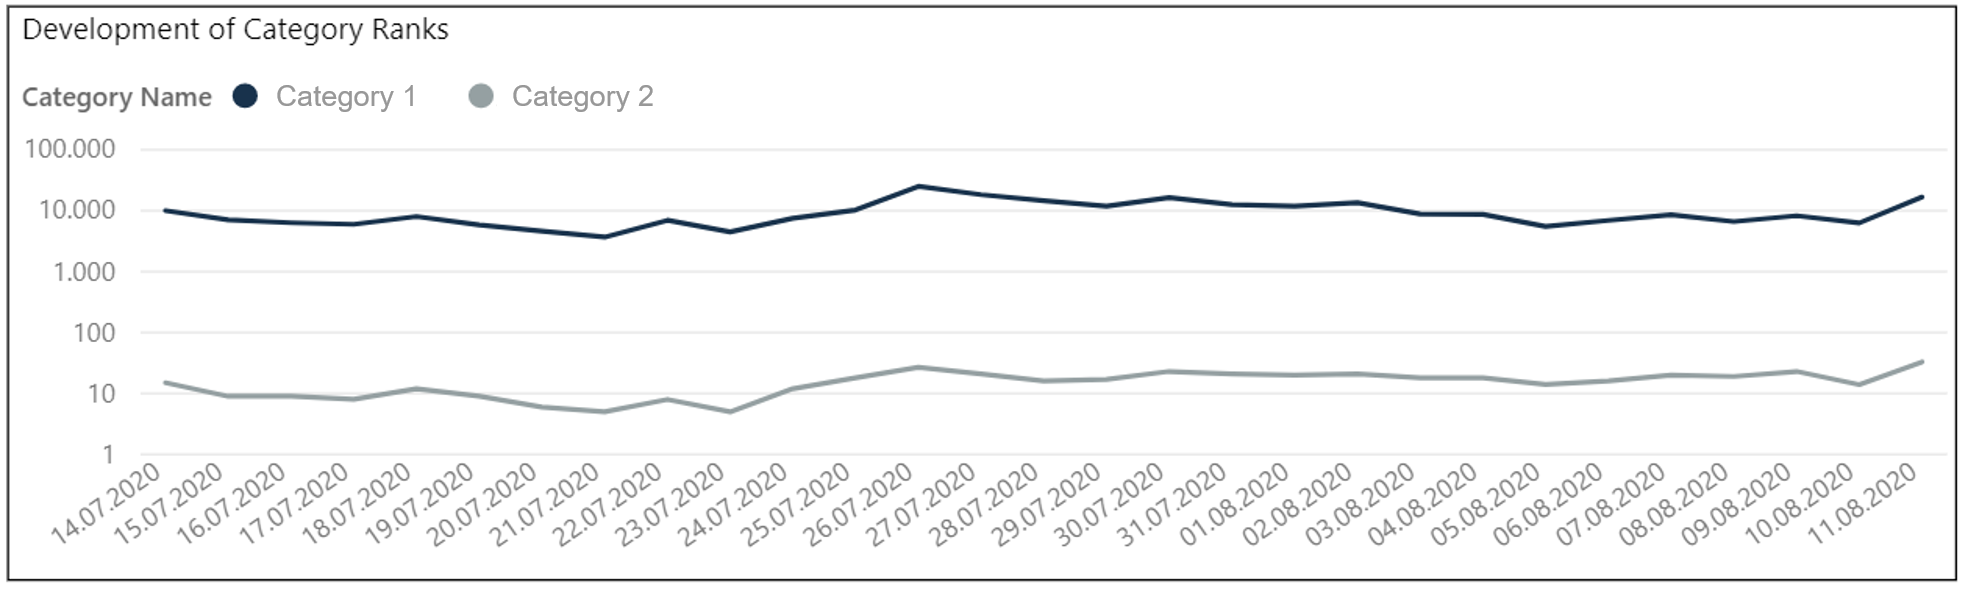
Development of Category Ranks
Shows the development of the Product’s Category Rank(s) over the last 30/90 days. All Categories of the Product are shown.
 Category Information
Shows the name of, and the rank in the Category, in which the product held the highest rank in the selected time period. Also shows the worst rank in the selected time period of this category.
6. Other reasons
Other reasons for performance issues that can be identifyed with the help of the Product Insights Report are:
-
Restricted buying options (e.g. plus products, Prime exclusive, pantry). These products are not suitable for advertising or only available for a subsegment of consumers (e.g. Prime members).
-
Identifying variations of a product becomes easier with the integration of the respective parent ASIN. This supports you in managing your advertised product portfolio more efficiently.
-
Missing product pages
Filters
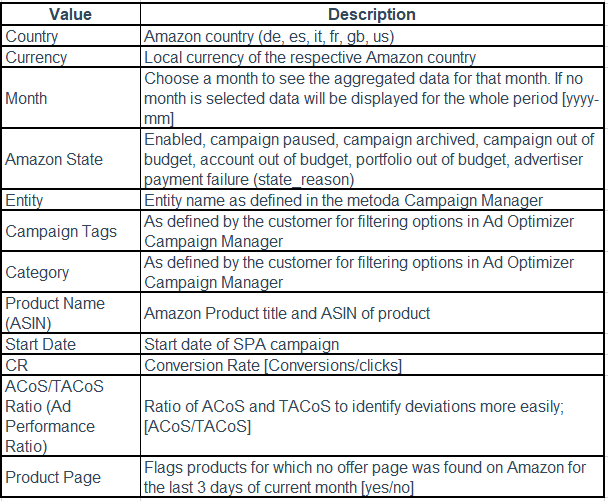
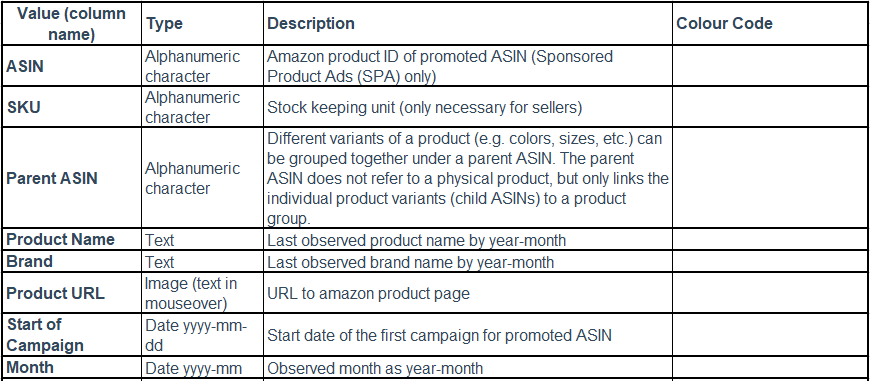
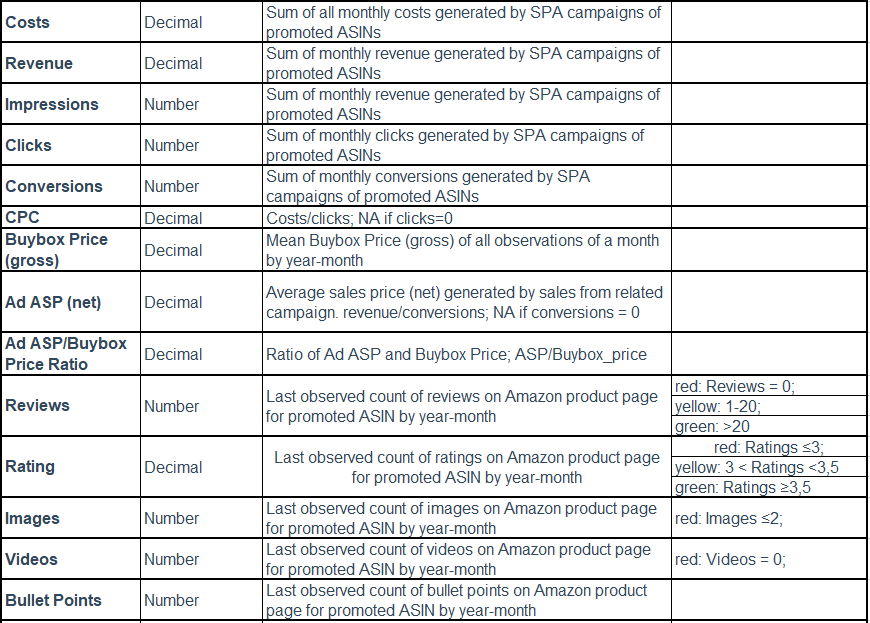
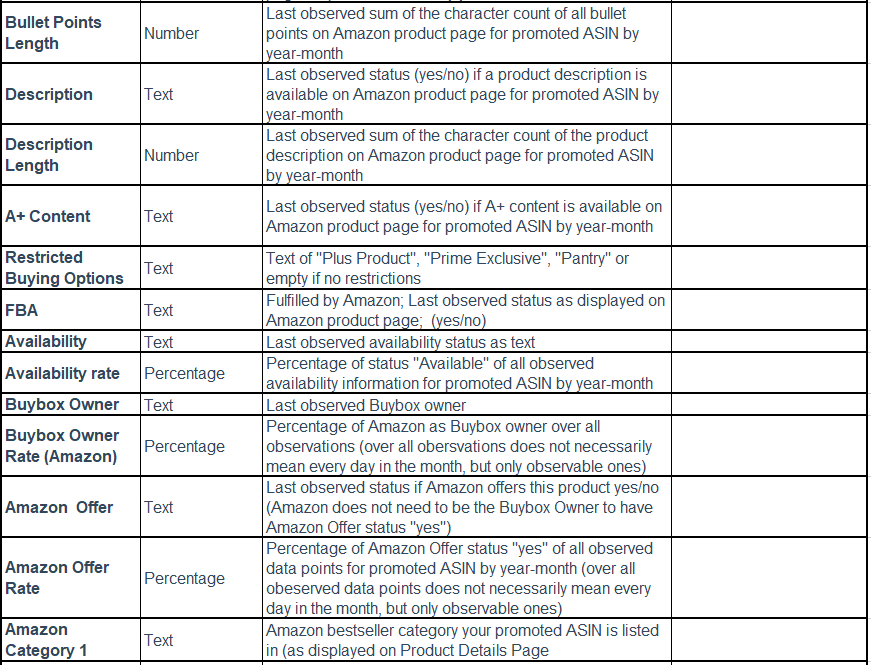
Description of column names/values and color codes