Scope:
Monitor and analyze your DSP campaign performance on Advertiser, Order, Line Item, and Creative level.
Important Note:
-
The data for the current day is excluded as Amazon does not provide real-time data.
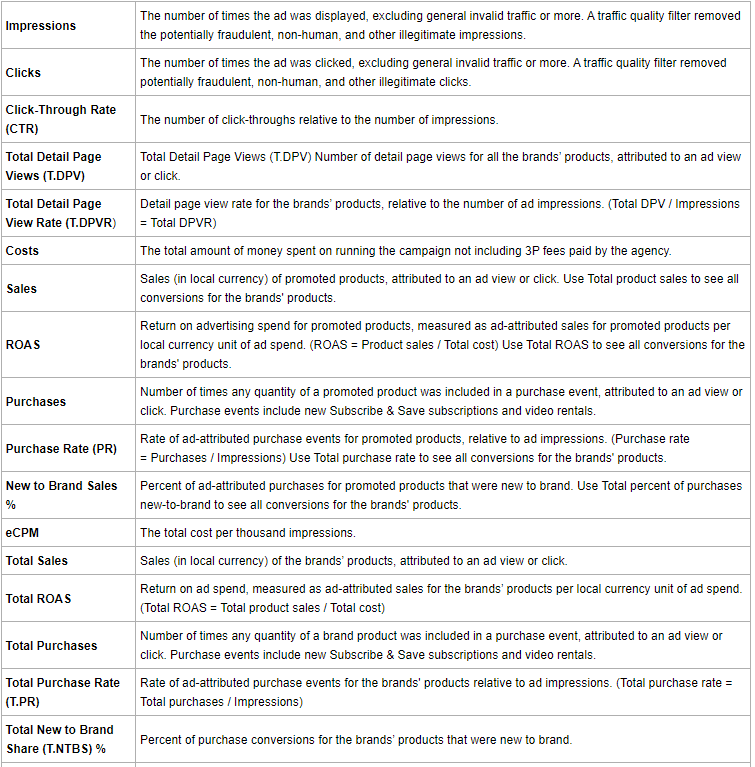
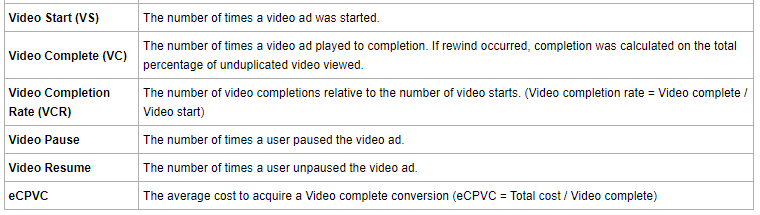
The DSP Performance Report is divided into several sections.
-
Filters
-
KPIs
-
Development of KPIs (day, month, year)
-
Performance Insights

1. Filters

2. KPIs

The filters selected in the first section are applied to the KPIs displayed in this section.
3. Development of KPIs
All the selected KPIs from the KPI section are displayed here including their development over time.

With the help of the drill-up function (marked green), you have the possibility to view the data on a monthly and yearly level.

4. Performance Insights
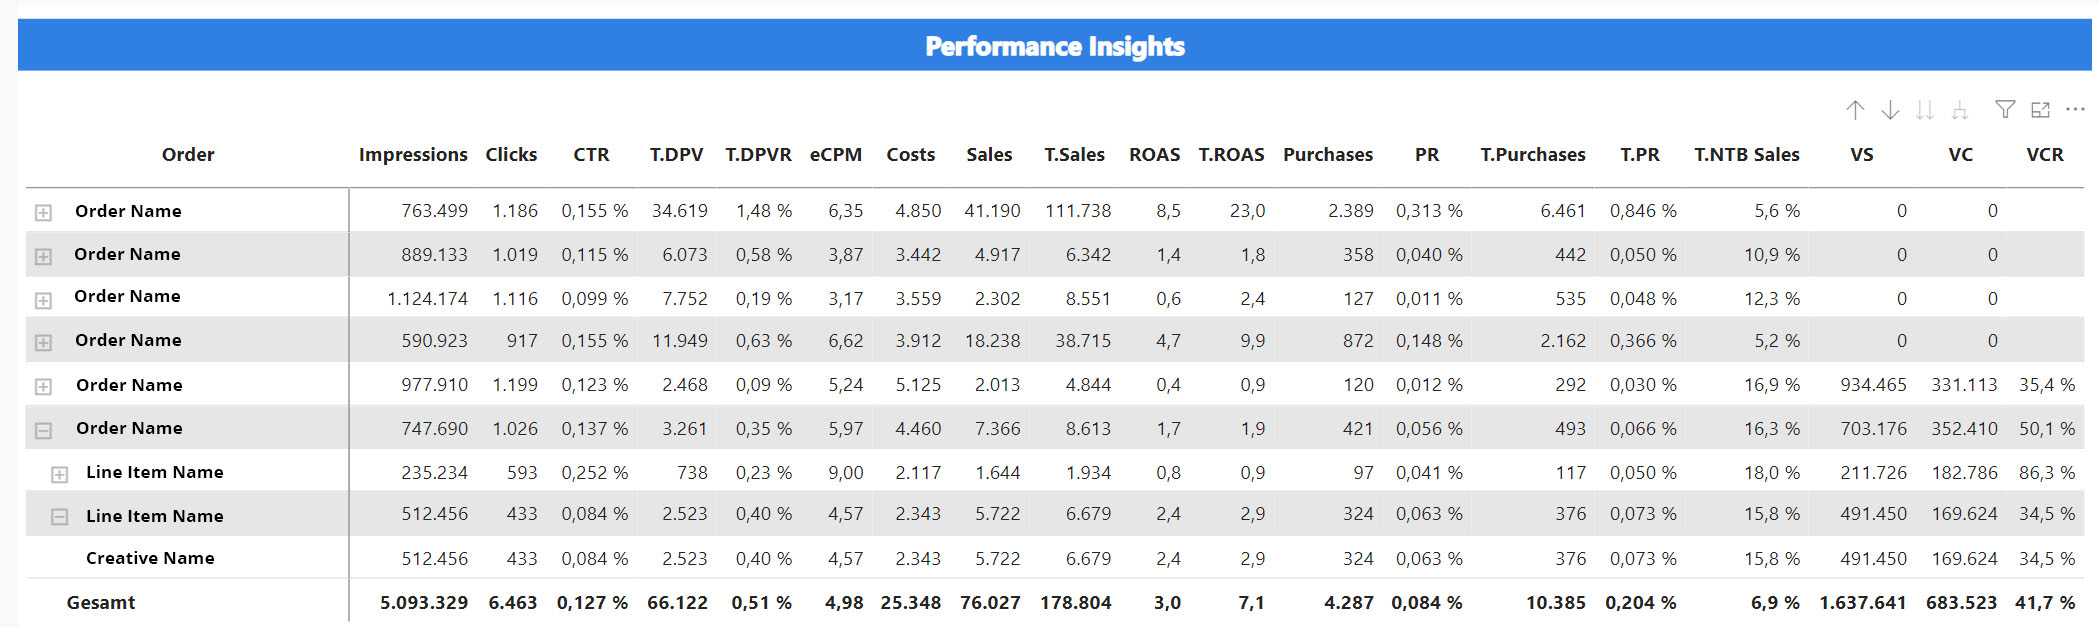
In this section (Performance Insights), you get an overview of your campaign performance on order level. If you click on the plus sign of your order, the performance on the line item level will be displayed. With a click on the line item name, the creative level will be displayed as well.
In this overview, you can also select a certain order, line item, or creative and the whole report data will be filtered for the selected performance (the rest will be hidden). To unselect the filter you have to click on the selected Line again.

Also here you can view the data on a Line Item and Creative level with the help of the drill-up function (green).

The three dots (marked green) offer the possibility to download the shown data as an Excel- or CSV-file (export can take several seconds). Here, you have two options:
- Summarized data: data as shown in the table
- Data with current layout: data as shown layout as a table
- Underlying data: all data from the whole report