
DSP Audience Insights - KPI Definitions and Use Cases
Scope:
Monitor and analyze the performance of your DSP Audiences on Advertiser, Order and Line Item level.
Important Note:
-
The data for the current day is excluded as Amazon does not provide real-time data.
-
Please note that campaign totals do not match performance data, as one shopper can be assigned to multiple segments/audiences.
The DSP Performance Report is divided into several sections.
-
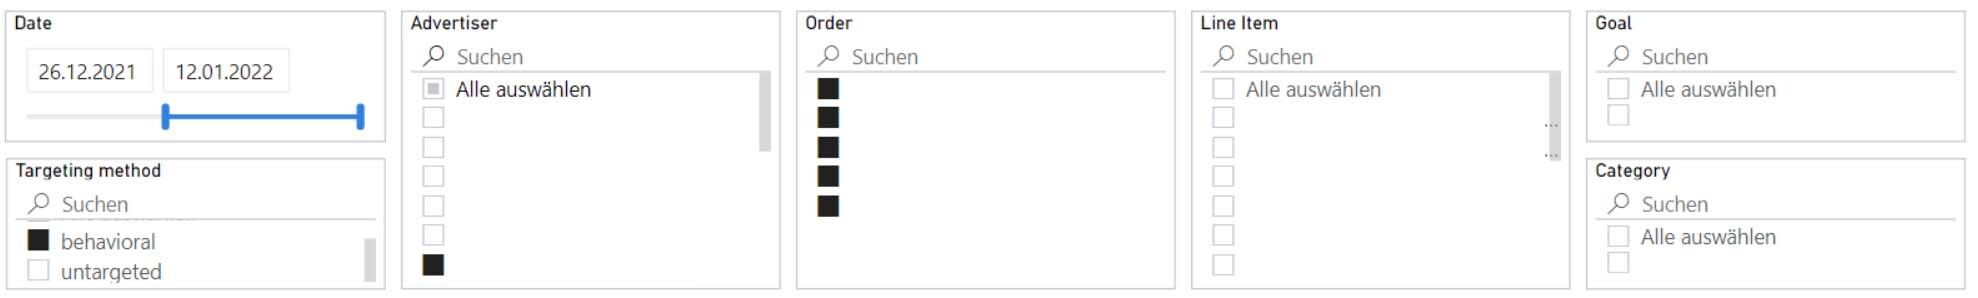
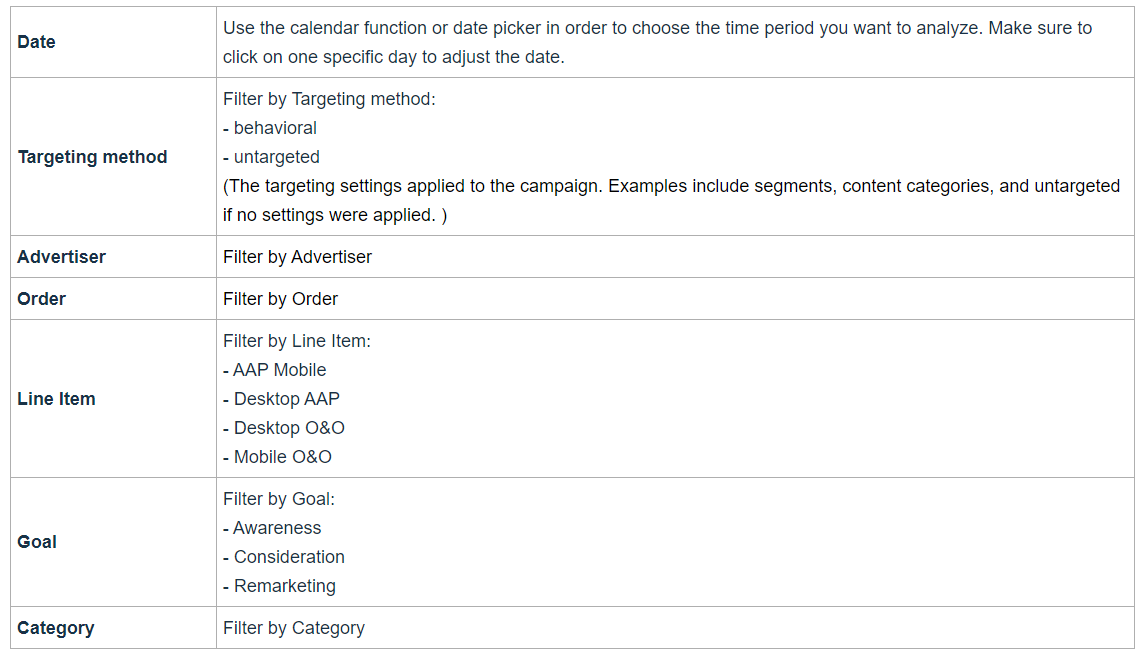
Filters
-
Audience Insights
1. Filters
2. KPIs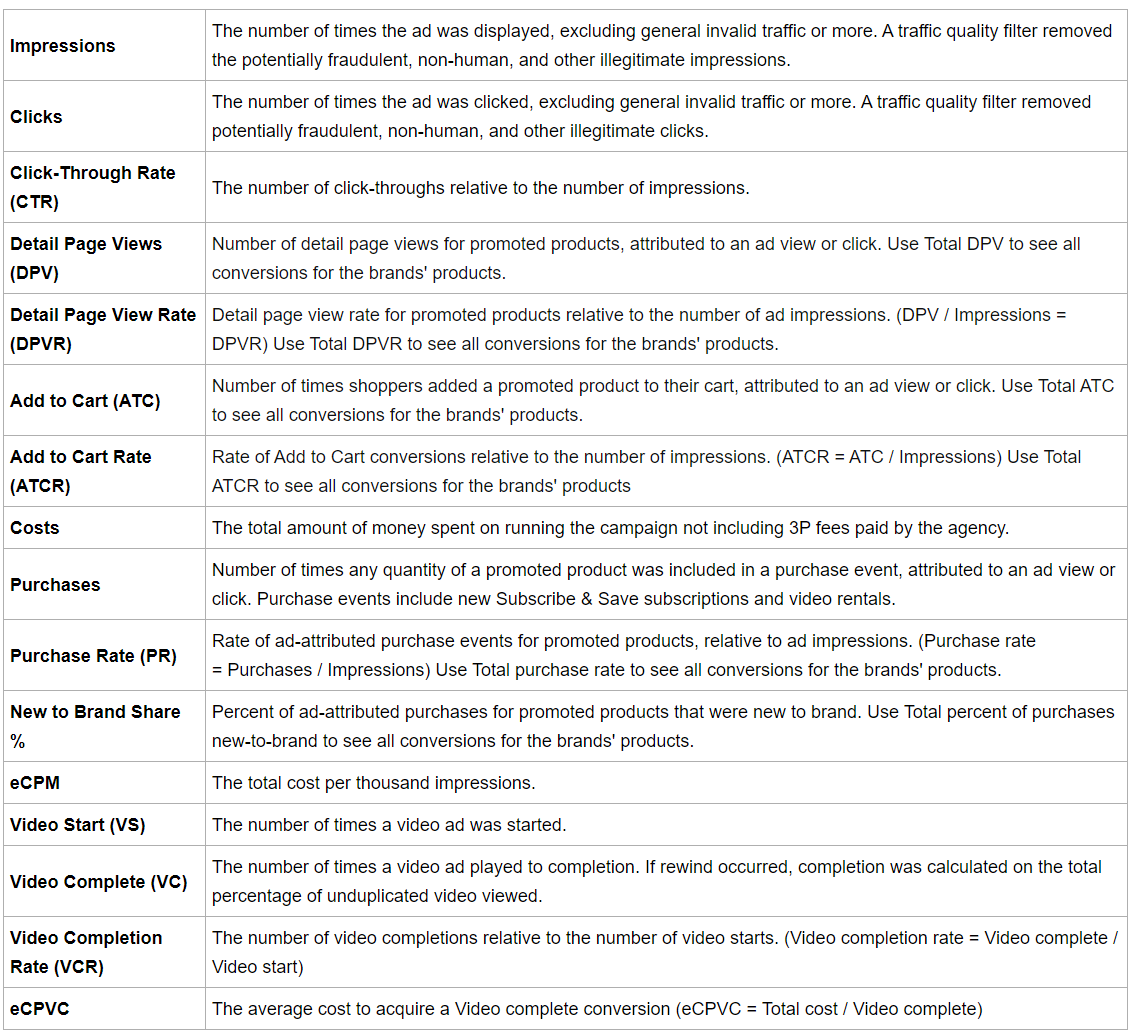
3. Audience Insights
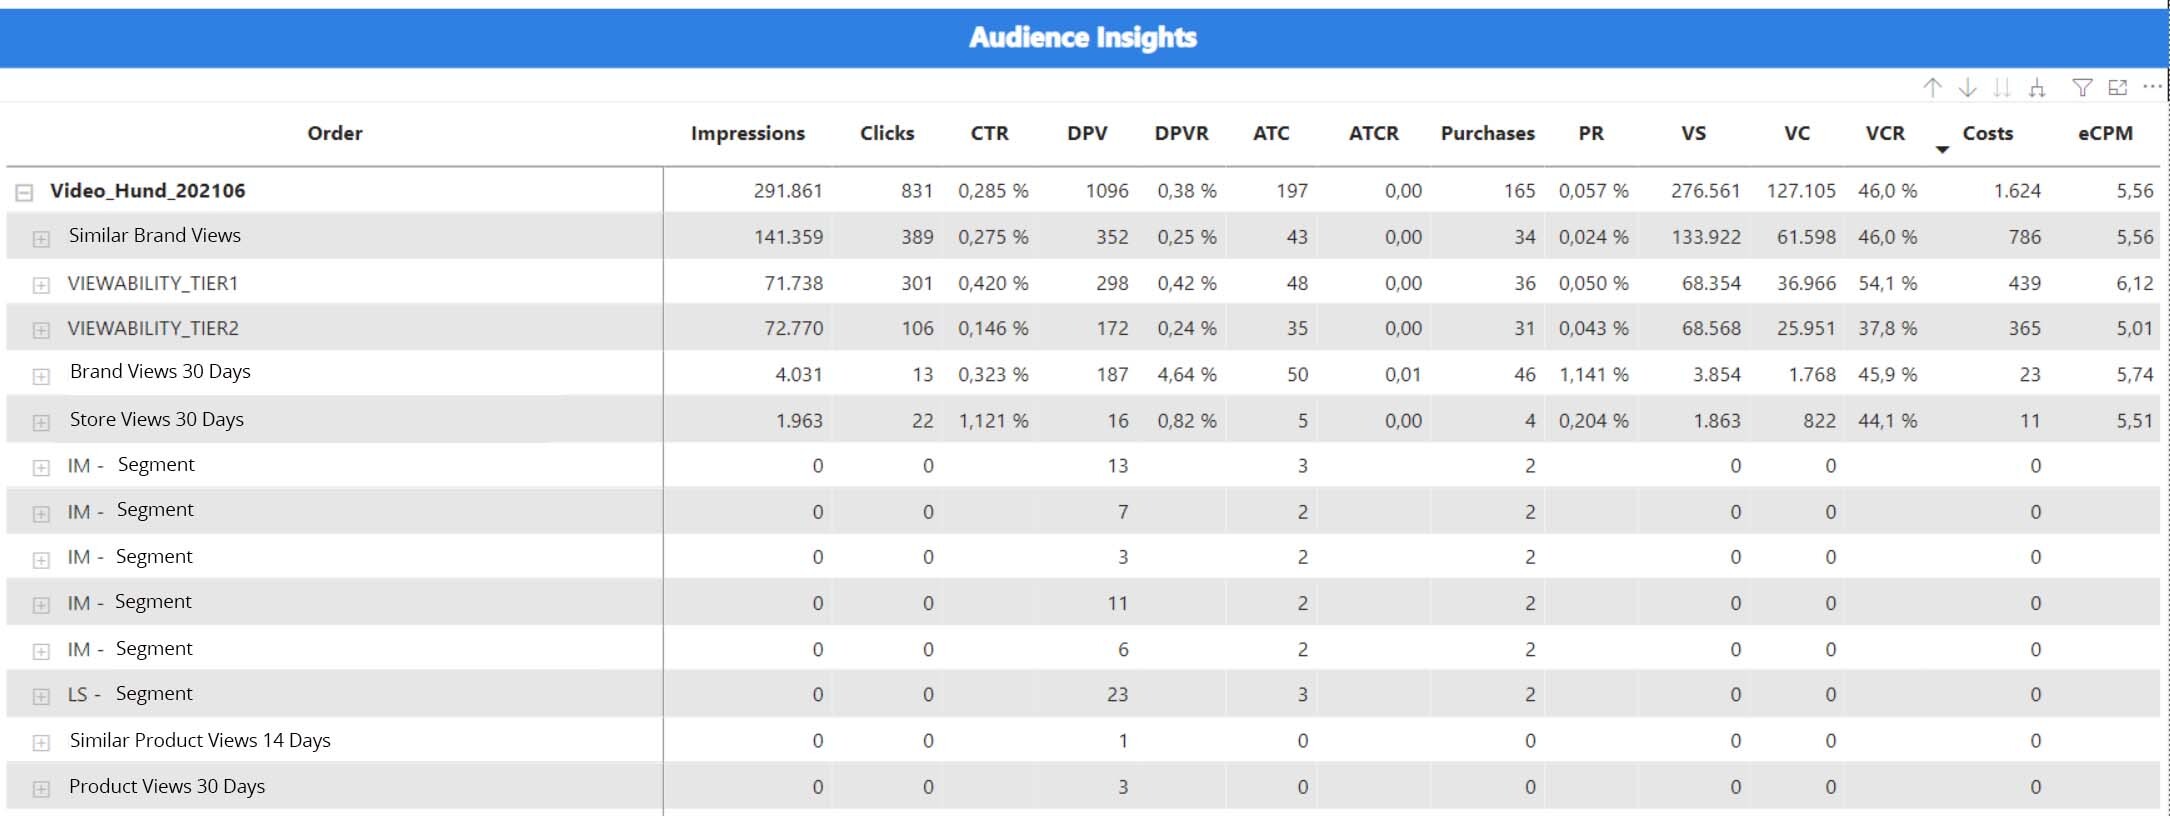
In this section (Audience Insights), you get an overview of your audience performance on order level. If you click on the plus sign of your order, the segments (/audiences) will be displayed. With a click on the segment name, the Line Item level will be displayed as well.
There are different types of Segments:
- Custom-build: Amazon Stores (Brand Store Views), Product (Product Views, Similar Product Views, Product Purchases), Brand (Brand & Similar Brand Views)
- IM: In-market
- LS: Lifestyle, Interest & Live event
- DEMO: Demographic
- Advertiser audiences: Pixel
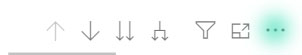
The three dots (marked green) offer the possibility to download the shown data as an Excel- or CSV-file (export can take several seconds). Here, you have two options:
- Data with current layout: data as shown layout as a table
- Summarized data: data as shown in the table
- Underlying data: all data from the whole report
